
PVsyst Power Generation
Report Services
Solyug Energy prepares PVsyst power generation reports that model expected energy yield for solar plants with the loss-by-loss detail lenders, investors, and independent engineers require before financing or approving a project. Our PVsyst simulation services India cover rooftop, C&I, and utility-scale ground-mount plants, producing bankable reports with full loss diagrams, performance ratio analysis, and P90/P95 generation estimates. A PVsyst report is only as reliable as the inputs and assumptions behind it. Ours are built on site-specific meteorological data, accurate near- and far-shading analysis, and system configuration matched to the actual detailed engineering design not a generic template run with default loss assumptions.
Why Lender-Grade PVsyst Precision Matters: Generic simulations run with default loss assumptions lead to severe generation shortfalls and debt-servicing risk. Solyug Energy utilizes data, verified OEM PAN & OND component files, 3D near-shading CAD integration, thermal derating modeling, and site-specific bifacial albedo calculations to deliver audit-ready P50/P95 reports trusted by Tier-1 lenders and IPPs.
What is a PVsyst
Simulation Report
PVsyst is industry-standard simulation software used to model a solar plant's expected energy generation based on location, system design, and a detailed accounting of every loss mechanism between theoretical irradiance and delivered AC energy. A PVsyst power generation report documents that simulation inputs, assumptions, loss breakdown, and resulting generation forecast in a format structured for technical review by EPCs, lenders, and independent engineers conducting due diligence.
Because PVsyst reports underpin financing decisions, performance guarantees in EPC contracts, and ROI calculations, the credibility of the report depends on transparent, defensible assumptions at every stage not just a final generation number.
Yield Assessment
P50 / P90 probability models
PVsyst Simulation
What Our PVsyst Reports
Include
From system configuration to P90/P95 estimates, everything lenders and EPCs expect to see.
Where Energy Is Lost
Sample loss breakdown, PVsyst-modeled
Monthly Specific Yield
kWh/kWp modeled across the year
What's Inside Every Report
Detailed engineering breakdown included in our deliverables
Complete system configuration: module and inverter specifications, string sizing, DC/AC ratio, tilt and azimuth
Site-specific meteorological data source and irradiance modeling
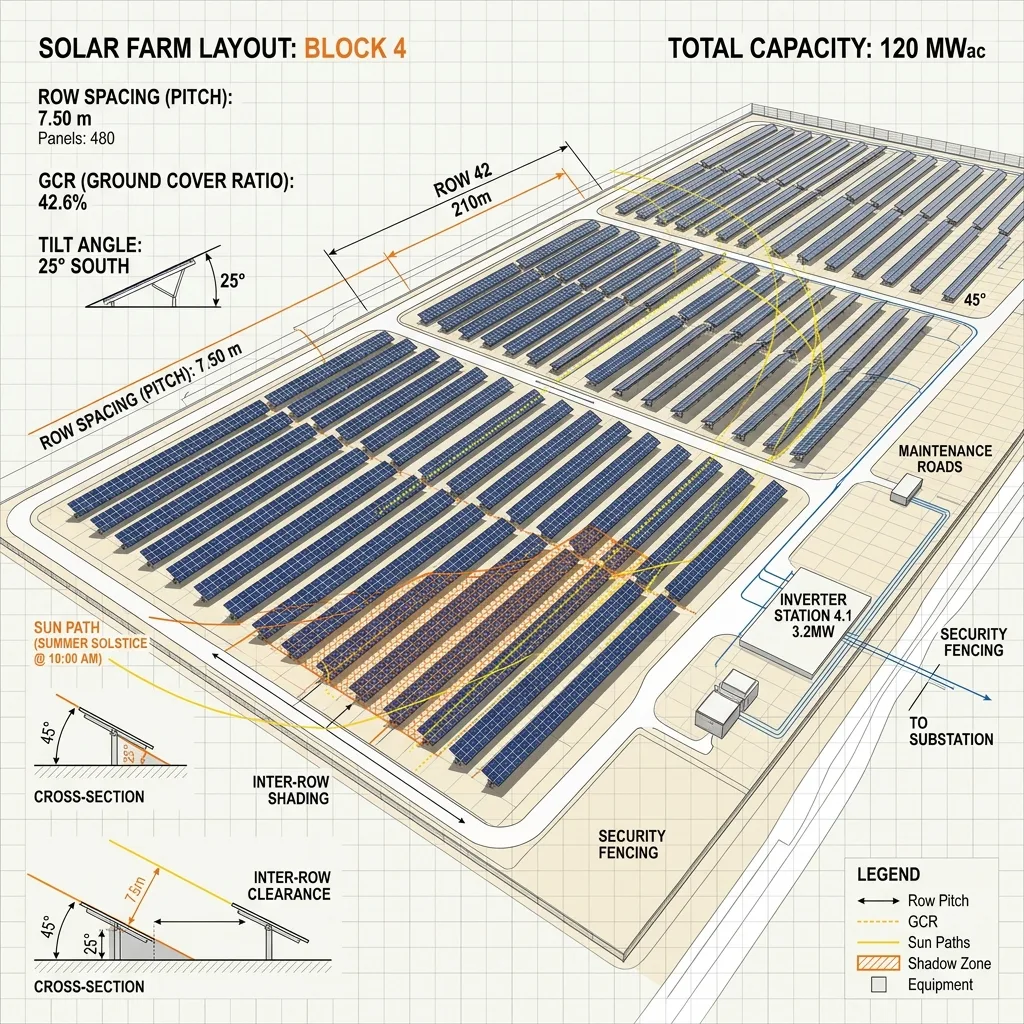
Near-shading analysis (on-site obstructions, inter-row shading) and far-shading analysis (horizon obstructions)
Full loss diagram: soiling, thermal, ohmic (DC/AC cabling), mismatch, inverter efficiency, light-induced degradation (LID), and availability losses
Performance Ratio (PR) calculation and benchmarking
Monthly and annual specific yield (kWh/kWp) and total generation forecast
P90/P95 probability-of-exceedance estimates for financing-grade reports
Calculations use 3D Near-Shading Scene + Meteonorm 8.1 Irradiance data
P90/P95 Generation,
Estimates for Lenders & Investors
No Cont

No Cont
P50 and P90 are probability-of-exceedance metrics that express generation forecasts as a range rather than a single optimistic number. P50 is the generation level expected to be exceeded in 50% of years (the statistical median case); P90 is the more conservative figure expected to be exceeded in 90% of years, accounting for interannual irradiance variability and uncertainty in the underlying meteorological data.
No Cont
Lenders and investors typically size debt financing against the P90 estimate specifically because it represents a conservative, high-confidence generation floor rather than a best-case projection. A PVsyst report for solar plant financing that presents only a single P50 figure without a P90 range is generally treated as incomplete by independent engineers conducting technical due diligence we include both as standard in financing-grade reports.
Our PVsyst Modeling Process
No Cont
System & Loss Diagram
01We configure the PVsyst model to match the project's actual system design module and inverter datasheets, string configuration, and layout geometry from the detailed engineering design then generate the full loss diagram tracing energy from global horizontal irradiance through to net AC energy delivered to the grid. Every loss category (soiling, thermal derating, ohmic, mismatch, inverter efficiency, LID, availability) is itemized individually rather than bundled into a single generic derate factor, which is what allows an independent engineer to actually validate the assumptions.

Performance Ratio (PR) Analysis
02Performance Ratio the ratio of actual delivered energy to the theoretical energy the system would produce under ideal conditions is calculated monthly and annually, then benchmarked against realistic industry ranges for the project's location and system type. PR is one of the first figures an independent engineer checks to sanity-test a report, since an unrealistically high PR is a common indicator of overly optimistic loss assumptions.

Meteorological Data & Irradiance Modeling
03Generation accuracy starts with the meteorological data source we use the most appropriate available dataset for the project location (satellite-derived or ground-station data, depending on availability and reliability for the region), applying appropriate uncertainty adjustments. This choice is disclosed explicitly in the report, since meteorological data quality is one of the largest drivers of variance between projected and actual generation.

Monthly & Annual Generation Forecast
04The final output is a monthly and annual specific yield (kWh/kWp) and total generation forecast, presented alongside the P90/P95 range and full loss breakdown structured so a lender, investor, or EPC team can trace the final number back through every assumption that produced it, rather than taking a single output figure on faith.

Our PVsyst Modeling Process
No Cont
System & Loss Diagram
01We configure the PVsyst model to match the project's actual system design module and inverter datasheets, string configuration, and layout geometry from the detailed engineering design then generate the full loss diagram tracing energy from global horizontal irradiance through to net AC energy delivered to the grid. Every loss category (soiling, thermal derating, ohmic, mismatch, inverter efficiency, LID, availability) is itemized individually rather than bundled into a single generic derate factor, which is what allows an independent engineer to actually validate the assumptions.
Performance Ratio (PR) Analysis
02Performance Ratio the ratio of actual delivered energy to the theoretical energy the system would produce under ideal conditions is calculated monthly and annually, then benchmarked against realistic industry ranges for the project's location and system type. PR is one of the first figures an independent engineer checks to sanity-test a report, since an unrealistically high PR is a common indicator of overly optimistic loss assumptions.
Meteorological Data & Irradiance Modeling
03Generation accuracy starts with the meteorological data source we use the most appropriate available dataset for the project location (satellite-derived or ground-station data, depending on availability and reliability for the region), applying appropriate uncertainty adjustments. This choice is disclosed explicitly in the report, since meteorological data quality is one of the largest drivers of variance between projected and actual generation.
Monthly & Annual Generation Forecast
04The final output is a monthly and annual specific yield (kWh/kWp) and total generation forecast, presented alongside the P90/P95 range and full loss breakdown structured so a lender, investor, or EPC team can trace the final number back through every assumption that produced it, rather than taking a single output figure on faith.